Healthy Crop
Converted Consumer Cameras and Unmanned Aerial Vehicles Assess Crop Health – Featured in InspectTriple Bandpass Filters are tools that allow us to go above and beyond traditional Normalized Difference Vegetation Index (NDVI) indicators to reinvent the way we monitor crop health and collect more information than ever before.
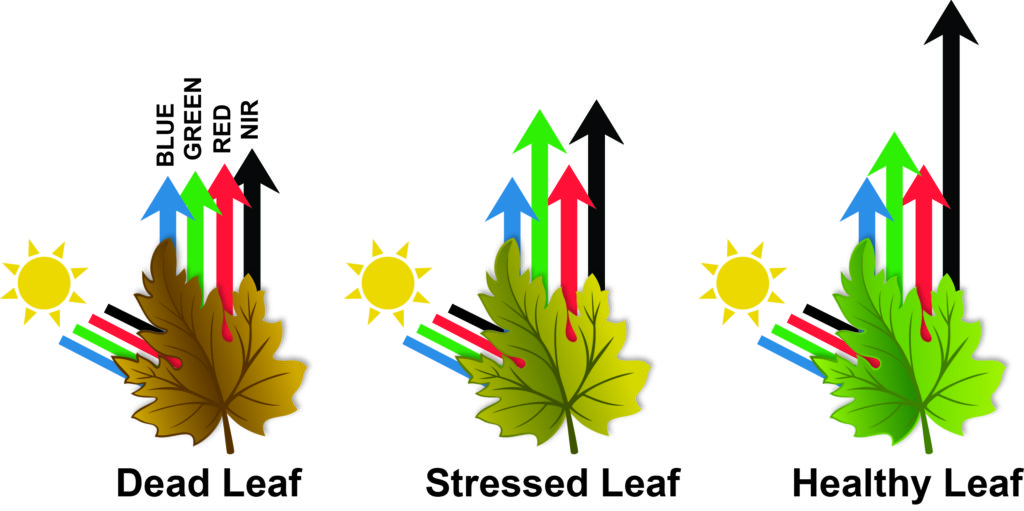
Traditionally, NDVI was used to determine plant health, which incorporates a camera with a red and near-infrared (NIR) filter—and the equation NDVI = (NIR – Red)/(NIR + Red). While this is a great tool, scientific advances have found that modifying this calculation can provide even more details about crop and field health. Similarly to red light, healthy plants also absorb visible blue light. And in addition to NIR light, healthy plants also reflect some visible green light. These facts enable us to assess crop health quickly, inexpensively and in realtime using converted consumer cameras and unmanned aerial vehicles.
New Triple Bandpass Filters
With this knowledge, MidOpt designed two innovative new Triple Bandpass Filters, which allow one camera to gather data results at all three wavelengths, making them an affordable, lightweight alternative to aerial surveillance applications that otherwise might require three or more cameras or sensors.
The TB550/660/850 filter takes the traditional red and NIR measurements to a whole new level by adding green. Green + Red + NIR wavelengths are used for applications where Chlorophyll Vegetation Index (CVI), Normalized Green (NG) and other vegetative index monitoring is needed. Two of the calculations used are as follows:
CVI = (NIR x Red)/(Green ^ 2)
NG = Green/(NIR + Red + Green)
Using the 475 nm, 550 nm and 850 nm wavebands differ from earlier calculations, since it uses Blue + Green + NIR light instead of the red-based method. It’s recognized as the Enhanced Normalized Difference Vegetation Index (ENDVI), a technique that can provide more detailed information. ENDVI may better isolate plant health indicators and can generate results and false color mapping to indicate values as far down as the pixel level (see image 1).
It can also generate information about plant growth, water usage, soil type and topography. Because our eyes are unable to see many of these variations, advancements in surveillance technology are critical. ENDVI can also provide information on chlorophyll levels, help identify unwanted weeds and more. The ENDVI formula is as follows:
ENDVI = ((NIR + Green) – (2 x Blue))/((NIR + Green) + (2 x Blue))
MidOpt Triple Bandpass Filters are offered in various standard threaded mounts and custom mounts that are cut to fit any lens or camera size. Standard material thicknesses include 0.5 mm, 1.1 mm and 2 mm.
NDVI History
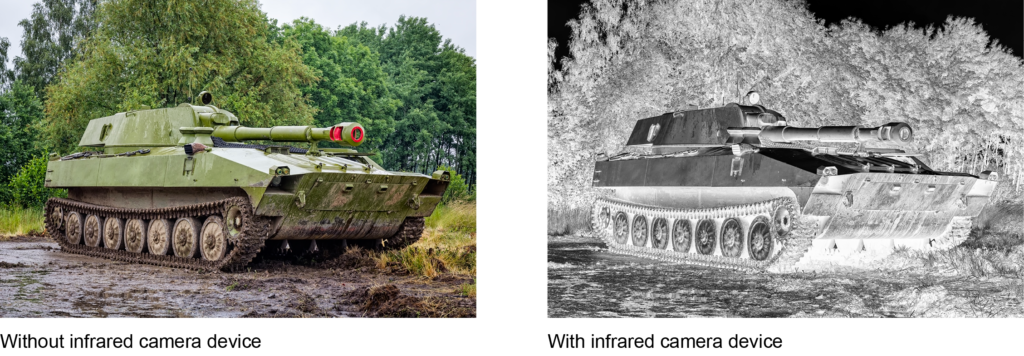
During World War II, the US military discovered that when looking through an infrared camera, vegetation appeared white, while a green object appeared dark (even though they both appeared green to the visible eye). Using infrared camera devices, the military could wash out vegetation and easily detect objects (see image 2).
Interested in the military’s findings, scientists began working on using visible and infrared cameras to detect when vegetation was healthy or stressed. They found that when plants were stressed, their NIR reflectivity decreased before the plant’s green color visibly changed, allowing for early detection that the plant may be suffering. A variety of mathematical formulas were developed to determine plant health, including the following:
NDVI = (NIR – Red)/(NIR + Red)
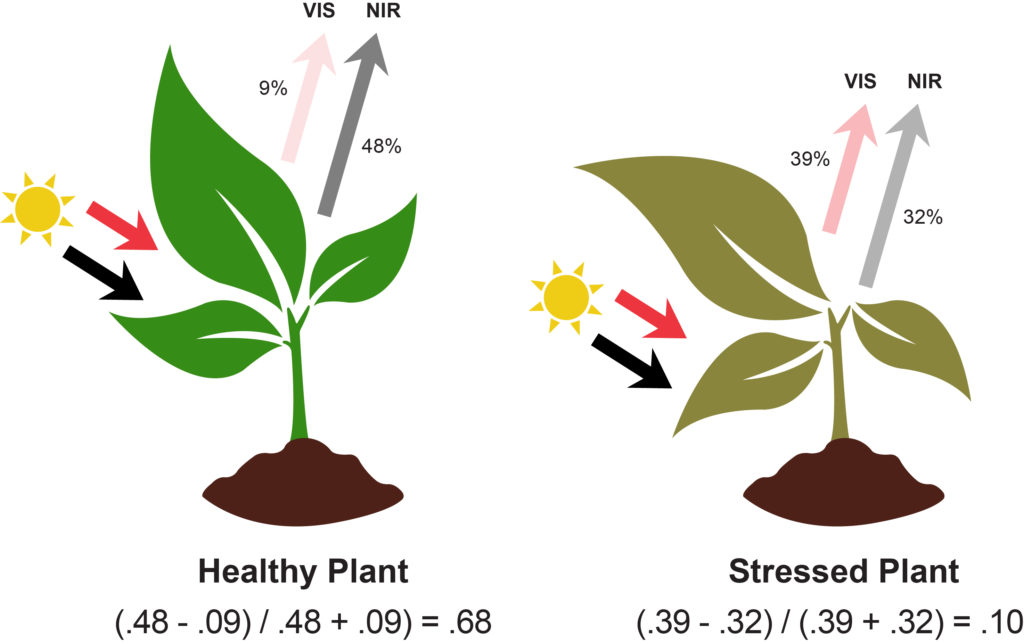
NDVI was formulated by Rouse et al. of the NASA/Goddard Space Flight Center in the early 1970s. The concept centered on the fact that chlorophyll in plants absorbs red light during photosynthesis, and healthy plants strongly reflect NIR light. Red NDVI is a number ranging between +1 and -1, with +1 indicating healthy plants and -1 indicating dead or extremely stressed plants.
As seen in image 3, the healthy plant on the left absorbs more red light and reflects more NIR light to produce a larger NDVI value. The stressed plant on the right absorbs less red light and reflects less NIR light resulting in a lower NDVI value.
Once it’s recognized that a plant is stressed, further investigation can reveal what may be causing the issue. Identifying the cause of the issue early on increases the odds of being able to save that plant or plant community.
This article was featured in Inspect Magazine.